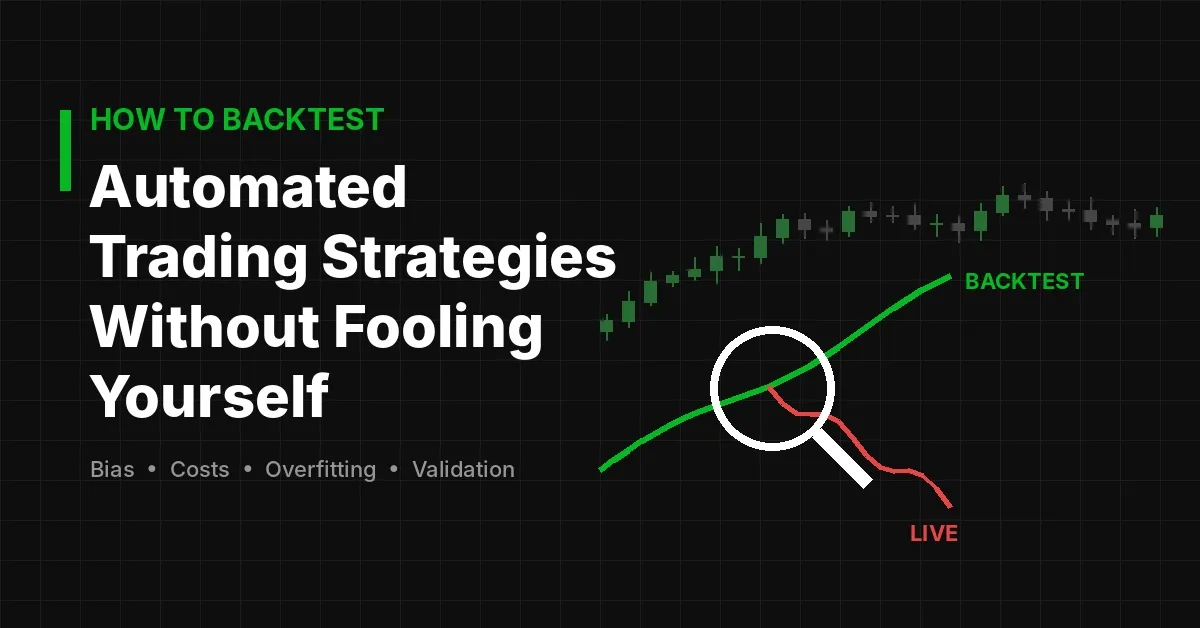
Every trader has seen it. A backtest shows a smooth equity curve, a tiny drawdown, and returns that look almost too good. Then the strategy goes live, and within weeks the results fall apart.
In most cases, the market did not suddenly change. Instead, the backtest was flawed from the start. After two decades of watching traders build and test automated trading strategies, I can say this with confidence: the most dangerous person in backtesting is you. Your hopes, your shortcuts, and your blind spots shape the results more than you think.
This guide explains how to backtest honestly. You will learn where bias creeps in, how to model real costs, and how to separate a genuine edge from a lucky curve. Above all, you will learn to treat every backtest as a hypothesis to challenge, not a trophy to admire.
A backtest is simply a simulation. It replays historical data and asks how a set of rules would have performed. However, history happens only once, and any simulation is only as good as its assumptions.
The real problem is psychological. When we design automated trading systems, we want them to work. As a result, we tend to accept good numbers without question and dig into bad numbers until they improve. Over time, this habit turns research into curve-fitting.
Furthermore, software makes it easy to run thousands of tests in minutes. Each test feels harmless. Yet every extra test raises the odds that a great-looking result is pure chance. Therefore, the first rule of honest backtesting is simple: decide what you are testing, and why, before you look at any results.
Every backtest of automated trading strategies stands on its data. If the data is wrong, the results are wrong, no matter how clever the logic is.
First, check for gaps, duplicate bars, and bad ticks. A single false price spike can create a winning trade that never existed. Next, confirm that prices are adjusted correctly for splits and dividends in stocks, or for contract rollovers in futures.
In addition, match the data resolution to the strategy. A scalping system cannot be judged fairly on daily bars, because it hides what happens inside each candle. Similarly, a stop-loss and a take-profit hit within the same bar create ambiguity. In that case, assume the worse outcome happened first.
Finally, test across enough history. Ideally, your sample should include bull markets, bear markets, sideways ranges, and at least one high-volatility shock. A strategy that has only seen one regime has not really been tested.
Look-ahead bias happens when a backtest uses information that was not available at the time of the trade. It is the most common silent killer of automated trading strategies.
For example, a rule that buys at the open based on that day's closing price is impossible in real life. Likewise, indicators that repaint, or that are calculated on a bar before it closes, can leak future data into past signals. To prevent this, make every decision on the close of a completed bar and execute on the next bar.
Survivorship bias is just as sneaky. If you test a stock strategy only on companies that exist today, you ignore every company that went bankrupt or got delisted. Consequently, the results look better than reality. A fair test uses a point-in-time universe that includes the losers, not just the survivors.
Many strategies that look profitable on paper are only profitable before costs. Once commissions, spreads, and slippage are added, the edge often disappears.
To begin with, include your broker's actual commission on every entry and exit. Then add the bid-ask spread, which widens during news events and quiet sessions. Slippage should also be included, because market orders rarely fill at the exact price you see on the chart.
As a rule of thumb, be generous with costs. If your strategy only survives with perfect fills, it is not robust. On the other hand, if it still makes money after you double the estimated slippage, you can trust it a little more.
Also, consider funding costs, overnight swaps, and liquidity limits. A system that trades large size in a thin market will move the price against itself. Backtests rarely capture that impact unless you model it on purpose.
Overfitting means a strategy has learned the noise in past data instead of a real market behavior. It is the main reason automated trading strategies collapse in live markets.
The warning signs are easy to spot once you know them. Too many parameters, very precise settings, and rules added to dodge specific past losses all point to a fitted model. For instance, a moving average of 37 that works while 35 and 40 fail is a red flag.
Instead, look for stable parameter zones. A sound strategy should perform reasonably well across a range of nearby settings, not just at one magic number. In addition, keep the rule set simple. Each new condition should be backed by a clear market reason, not by a better-looking equity curve.
Moreover, keep a log of every test you run. If you tried 500 variations before finding one winner, that winner deserves far more doubt than a result found on the first or second attempt.
The best defense against self-deception is data the strategy has never seen. Therefore, split your history before you start.
A common approach is to use around 70% of the data for development and lock the remaining 30% away. Only after the rules are final should you run them on the hidden portion. If performance drops sharply, the strategy was probably fitted to the past. Importantly, you only get to use that out-of-sample data once. Re-tuning after peeking turns it into in-sample data.
Walk-forward analysis takes this idea further. Here, the strategy is optimized on one window, tested on the next, and then the window rolls forward. This process is repeated across the full history. As a result, you see how the method behaves when it is re-tuned over time, much like it would be in real use.
In addition, Monte Carlo simulation is worth running. By shuffling trade order or resampling returns, you get a range of possible drawdowns rather than a single, often optimistic, number.
Not all automated trading systems fail in the same way. That is why it helps to understand the main types of automated trading strategies and the traps each one faces.
In short, the types of automated trading strategies you choose decide which biases matter most. A test plan that ignores this will miss the real risks.
When reviewing automated trading systems, net profit is the least useful number in a backtest report. On its own, it says nothing about risk, consistency, or luck.
Instead, focus on a few core measures. Maximum drawdown shows how much pain you must endure, and it is usually larger in live trading than in testing. The profit factor and the Sharpe ratio show how efficiently the strategy earns returns relative to losses and volatility. Meanwhile, the number of trades tells you whether the sample is large enough to mean anything. As a general guide, fewer than 100 trades is rarely enough for firm conclusions.
It is also wise to study the equity curve itself. Are profits spread evenly, or do two or three trades produce most of the gains? A result driven by a handful of outliers is fragile. Furthermore, check performance by year and by market regime. Consistency across periods matters far more than one spectacular stretch.
Even a clean backtest is still a look at the past. So, the final step is forward testing on live data, either on a demo account or with very small size.
This stage reveals problems that history cannot. For example, real fills, platform delays, data feed errors, and broker rules all show up here. Run the forward test for at least several weeks, or long enough to collect a meaningful number of trades. Then compare the live results with the backtest. Small gaps are normal, but large gaps mean something in the model was unrealistic.
Before going live, run through this short checklist:
If any answer is no, the strategy is not ready yet. Honestly, that is good news, because finding the flaw now is far cheaper than finding it with real money.
Backtesting is not about proving that a strategy works. Rather, it is about trying hard to prove that it does not, and seeing what survives. When you approach automated trading strategies with that mindset, the numbers become far more trustworthy.
To sum up, clean your data, remove look-ahead and survivorship bias, and model costs generously. After that, guard against overfitting, test on unseen data, and confirm everything with a forward test. Most importantly, stay skeptical of results that look perfect.
The same discipline applies when you review any third-party tool or signal provider, including GainzAlgo. Traders who ask "is GainzAlgo legit" should judge it the way this guide suggests: check whether results include realistic costs, whether signals are free of repainting, and whether performance holds up on out-of-sample and live data. In the end, a careful process protects you far better than any promise of returns.

This post has been authored and published by one of our premium contributors, who contribute researched and informative content to our platform.